Understanding Elevation Maps
A Grade 10 social studies worksheet on interpreting and analyzing elevation maps, including contour lines, relief, and common map symbols.
Includes
Standards
Topics
Understanding Elevation Maps
Name:
Date:
Score:
Carefully read each question and provide your answer in the space provided. Refer to the elevation map image as needed.
Refer to the image below to answer the following questions.
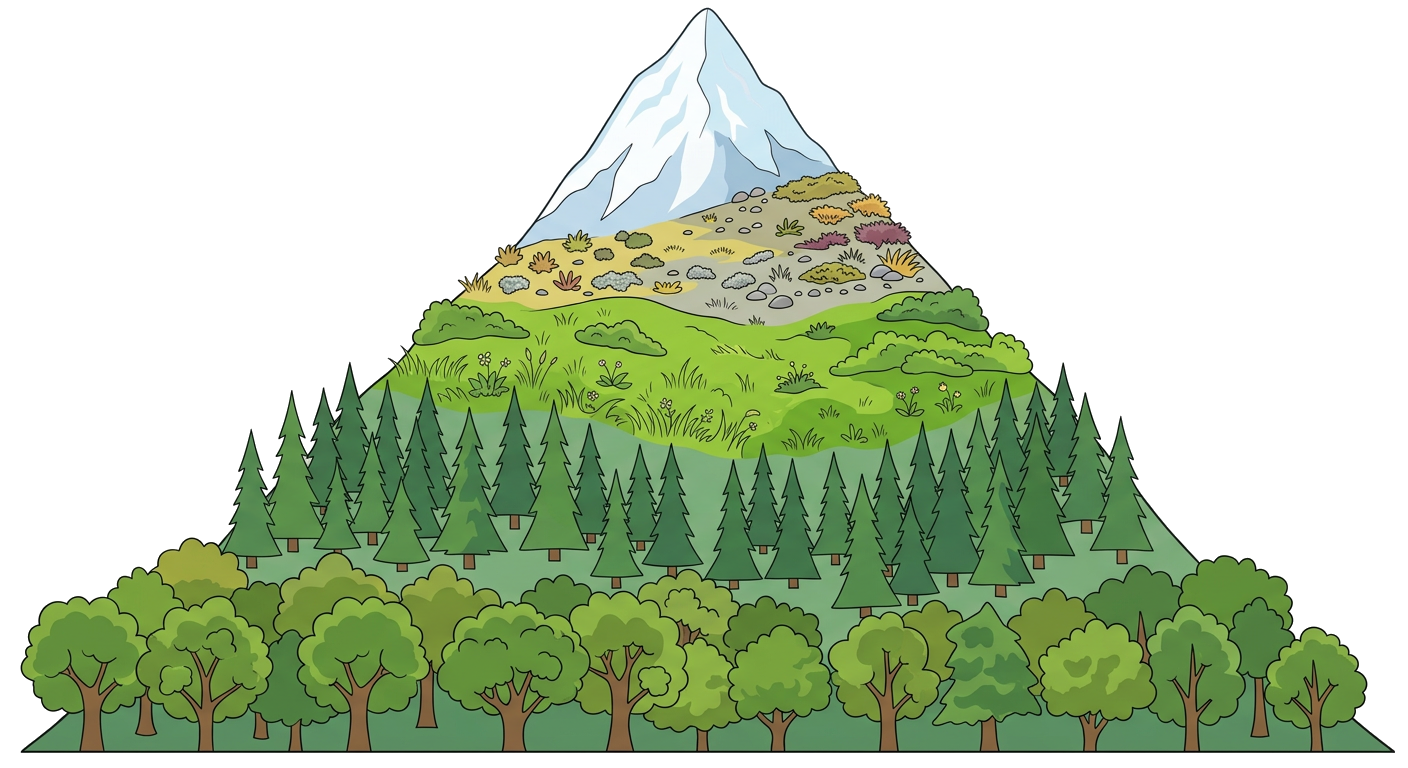
1. What do contour lines on an elevation map represent?
Areas of equal rainfall
Lines connecting points of equal elevation
Boundaries between different countries
Major rivers and their tributaries
2. Closely spaced contour lines indicate a slope, while widely spaced lines suggest a slope.
3. Explain the difference between elevation and relief as depicted on a map.
4. A V-shaped contour line pointing uphill indicates a river flowing downstream.
True
False
5. Match the map symbol with its description.
A. Index Contour
1. A line connecting points of equal depth underwater.
B. Benchmark
2. A contour line that is thicker and often labeled with its elevation.
C. Spot Elevation
3. A specific point on a map where the exact elevation is known and marked.
D. Bathymetric Line
4. A permanent marker placed by surveyors to indicate a precise elevation.
Related Worksheets
Geographical Boundaries Worksheet
Explore different types of geographical boundaries, their formation, and their impact on human societies and international relations.
Population Density Basics
Explore the concept of population density, its calculation, and factors influencing it with this Grade 10 social studies worksheet.
Understanding Global Time Zones
A Grade 10 Social Studies worksheet covering the basics of time zones, including their purpose, calculation, and global impact.
Population Studies Worksheet
This worksheet covers key concepts in population studies, including demographics, population growth, and factors influencing population distribution.
Meridians and Parallels Worksheet
Explore the concepts of meridians (lines of longitude) and parallels (lines of latitude) and their importance in geography and navigation.
Population Pyramid Analysis
This worksheet helps students understand and analyze population pyramids, their different shapes, and what they reveal about a country's demographic characteristics.
Understanding Map Projections
This worksheet covers various aspects of map projections, their types, distortions, and uses for Grade 10 Social Studies students.
North American Historical Maps
Explore the historical evolution of North America through maps, focusing on territorial changes, indigenous lands, and colonial influences.