Understanding Elevation Maps
A Grade 12 social studies worksheet focusing on interpreting and analyzing elevation maps, including contour lines, relief, and practical applications.
Includes
Standards
Topics
Understanding Elevation Maps
Name:
Date:
Score:
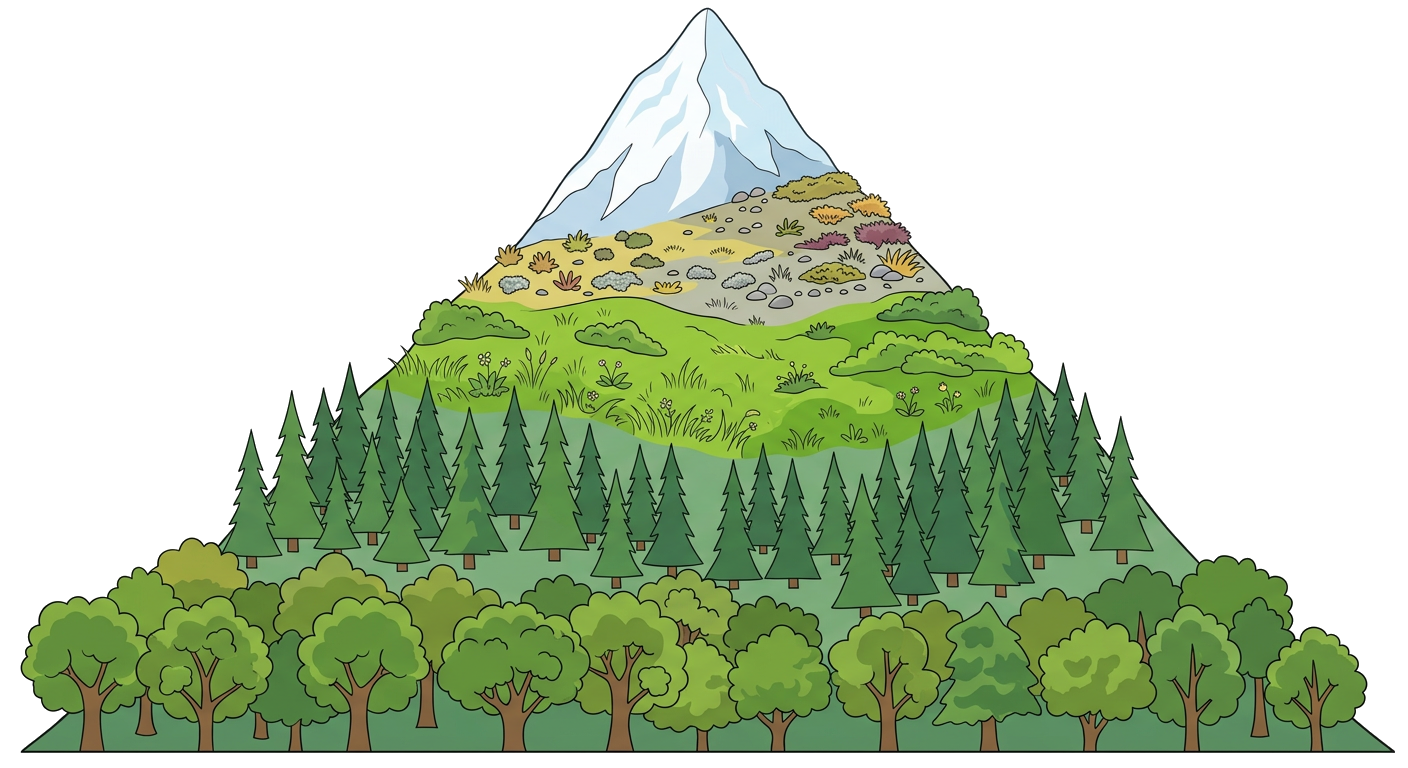
Read each question carefully and provide thoughtful, well-reasoned answers. Refer to the provided image and your knowledge of elevation maps to answer the questions.
Elevation maps, also known as topographic maps, are essential tools for understanding the physical landscape of an area. They use contour lines to represent changes in elevation, allowing us to visualize mountains, valleys, and other landforms.
1. What do closely spaced contour lines on an elevation map indicate?
A gentle slope
A steep slope
A flat area
A river valley
2. What is the term for the difference in elevation between two adjacent contour lines?
Index contour
Relief interval
Contour interval
Elevation gradient
3. Contour lines that form a 'V' shape on an elevation map typically indicate a or a valley.
4. The highest point of elevation on a topographic map is often marked with a or a benchmark.
5. All points on a single contour line have the same elevation.
True
False
6. Contour lines can cross each other, especially in areas of extreme relief.
True
False
7. Explain how an understanding of elevation maps can be crucial for urban planners or emergency services.
8. Describe the difference between an index contour and an intermediate contour line on a topographic map.