Color Sort Challenge
A Grade 3 math worksheet focusing on data sorting and graphing using colors.
Includes
Standards
Topics
Color Sort Challenge
Name:
Date:
Score:
Read each question carefully and follow the instructions to sort and count colors.
Look at the colored pencils below. We will use these to answer the questions.
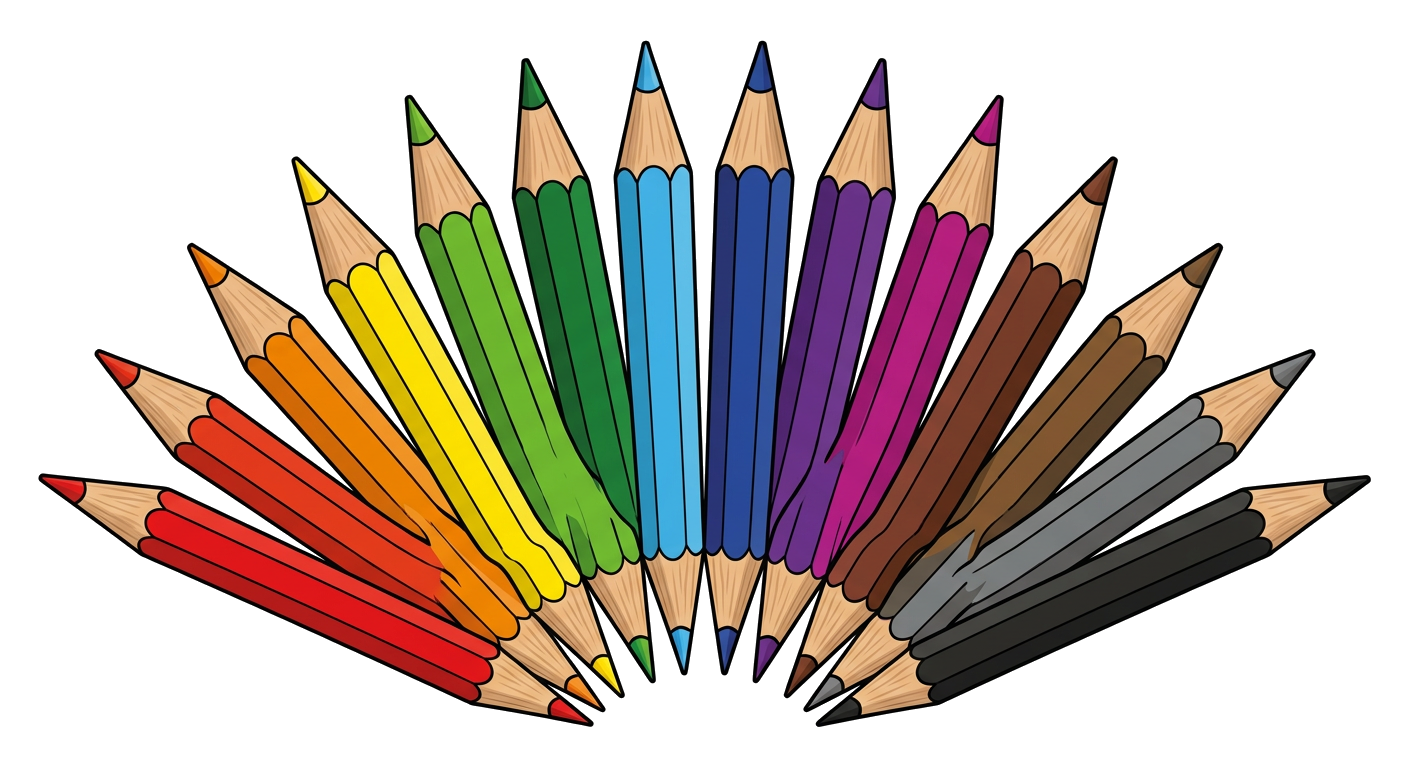
1. Count how many pencils there are of each color and fill in the blanks.
Red:
Blue:
Green:
Yellow:
2. Which color has the most pencils?
Red
Blue
Green
Yellow
3. There are more red pencils than yellow pencils.
4. If you had 2 more blue pencils, you would have blue pencils.
5. Imagine you put all the pencils in a bag. If you picked one out without looking, which color would you be most likely to pick? Why?
6. Create a bar graph to show the number of pencils for each color. Label the axes.
Related Worksheets
Graph Features Practice
A worksheet for 3rd graders to practice identifying and interpreting features of bar graphs and pictographs.
Combining Data Worksheet
A Grade 3 math worksheet focusing on combining data from different sources and interpreting bar graphs.
Understanding Data Tables
A Grade 3 math worksheet to help students understand and interpret data presented in tables.
Understanding Bar Graphs
A worksheet for 3rd graders to practice identifying key features of bar graphs, including title, labels, and data interpretation.
Reading Tables Worksheet
A Grade 3 math worksheet focused on reading and interpreting data from tables.
Qualitative vs. Quantitative Data
Explore the difference between qualitative and quantitative data with this engaging worksheet for 3rd graders.
Grade 3: Reading Bar Charts
A worksheet for 3rd graders to practice reading and interpreting bar charts.
Tally Marks Practice
A Grade 3 math worksheet focused on understanding and using tally marks to represent data.