Physics Data Interpretation Worksheet
A Grade 9 Science worksheet focusing on interpreting data from graphs and tables in physics contexts.
Includes
Standards
Topics
Physics Data Interpretation
Name:
Date:
Score:
Read each question carefully and analyze the provided graphs and data tables to answer. Show all your work where applicable.
The graph below shows the distance traveled by a car over time.
1. Describe the motion of the car during the first 2 seconds.
2. Calculate the acceleration of the car between 2 and 4 seconds.
Use the following terms to complete the sentences: , , , .
3. In an experiment, the factor that is changed by the experimenter is the variable.
4. The factor that responds to the changes in the experiment is called the variable.
5. A factor that is kept constant throughout the experiment is a .
6. Which of the following best describes the slope of a distance-time graph?
Acceleration
Velocity
Displacement
Time
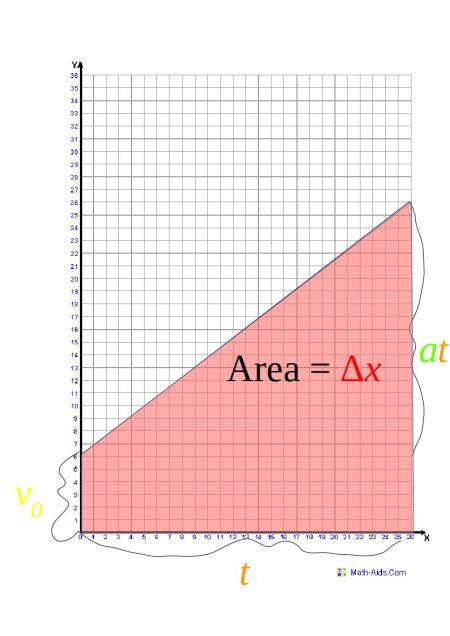
7. What does the area under a velocity-time graph represent?
Speed
Acceleration
Displacement
Force
Read each statement and indicate whether it is True or False.
8. A line of best fit should always pass through the origin (0,0).
True
False
9. Extrapolation involves predicting values within the range of measured data.
True
False
10. A student measures the time it takes for a ball to roll down ramps of different angles. Identify the independent and dependent variables in this experiment.
Independent Variable:
Dependent Variable:
11. Suggest two control variables for the experiment described above.